Find API Report
The Find API Report from the Omnichannel Personalization dashboard offers the performance of multiple metrics for the given data range.
To view the Find API report:
On the Omnichannel Personalization Dashboard page, go to Reports > Find API Report.

Filters
With all the Algonomy reports, the date range is the first option that can be adjusted. You can specify a custom date range by selecting start date and end date, or you can select from a list of presets, such as Week, Month, Quarter, and Year.
Metrics
You can choose between the following metrics. Changing the chosen metric will immediately refresh the chart.
- Total Call Count: Distinct count of API hits in time interval of 3000 milliseconds.
-
Total Raw Call Count: Total count of API hits.
Note: If there are multiple API calls within 3 seconds, it will be considered as a single API call. For allfindmethods, any of the find method call that happened within 3 seconds will be considered as a single API call. Whereas, for individual methods, the same method call should happen.
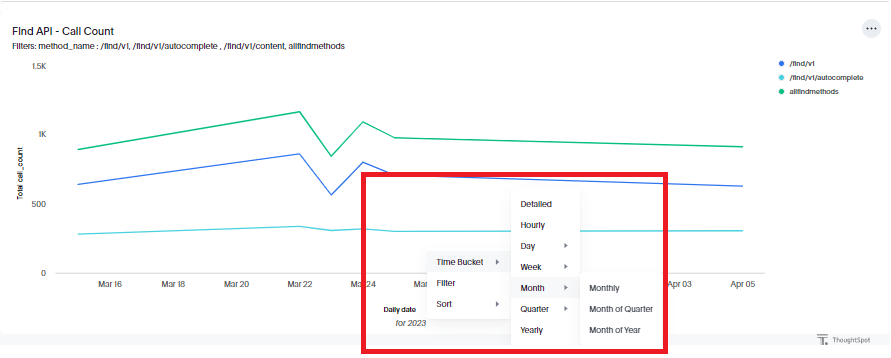
The graphical visualization is available for both the metrics Total Call Count and Total Raw Call Count on the daily date trend. You can view weekly/monthly data by looking at the monthly trend using the filter option.

Methods
It provides different Find methods as part of the report:
-
/find/v1/autocomplete
-
/find/v1
-
/find/v1/content
-
allfindmethods: This includes all the Find methods (/find/v1/autocomplete, /find/v1, and /find/v1/content)
Table
The data table under the chart displays all the data available based on the date range and filter options selected across all the metrics. Click View Report Detail to view the table.
The Table report includes the following raw data:
-
Daily date
-
Method name
-
Total call count
-
Total raw call count
