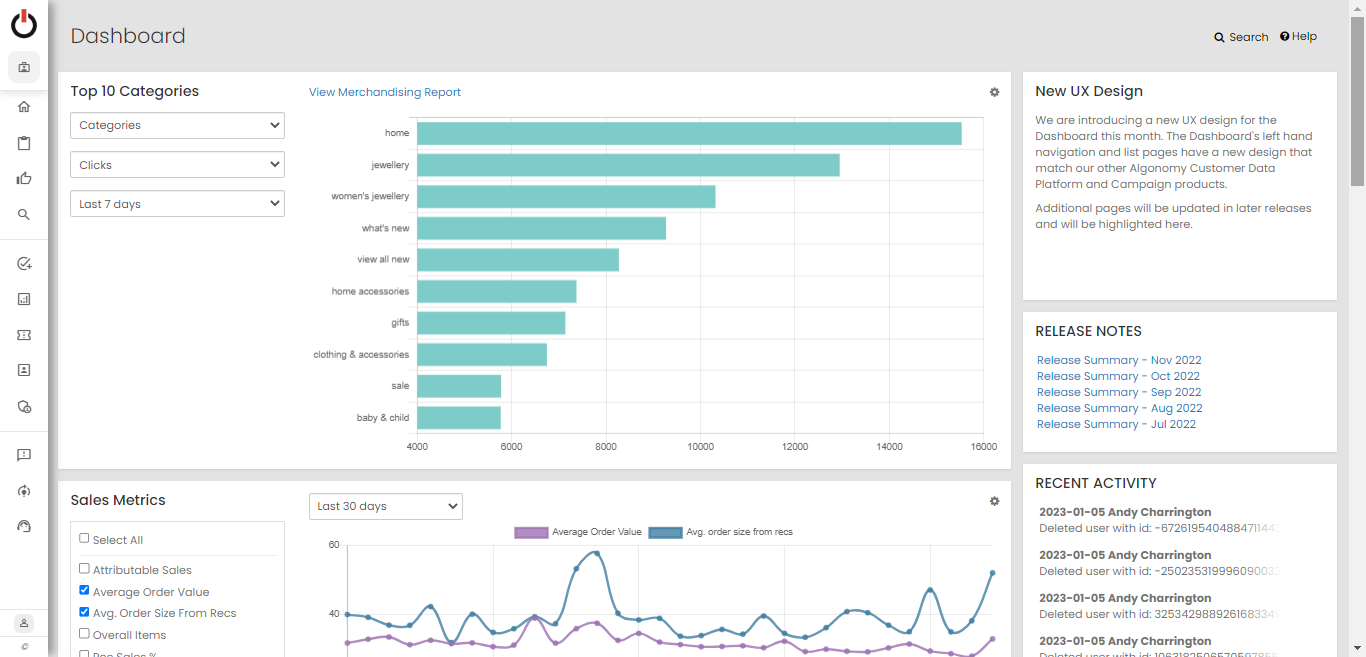
Personalization Dashboard
The Algonomy Personalization Dashboard provides users with all that they need to control and maintain their Algonomy products.
When you log into the Algonomy Personalization dashboard, you will see menus that enable you to interact with the product settings and configurations, as well as to view reports, the activity of other users, and your own recent history of the pages that you have visited.

On the left side of the screen, you will find the menu and navigation. Hover over the Algonomy logo at the top of the screen to see the left navigation rail. The menu items under the left navigation rail can be collapsed to give you more space. All of the various configuration screens have been consolidated under the product to which they belong. For example, you will find all of the pages you need to configure Find under Search | Browse; Engage under Content, and Recommend under Recommendations.
Note: There have been few changes to the organization of the menu. For a summary of those changes you can review the page Omnichannel Personalization: Navigation Changes in the New Dashboard.

To see the items contained in each menu option, click to expand the menu.

Under the product specific items, there are five other navigation options:
Optimization, which contains the menu items Data Science Workbench, Experience Optimizer, Model Browser, Model Builds, and MVT.

Reports, which contains all of the various reports currently available to you, based on which products you are using and your permissions on your account. The beta reports are now GA, but we have left the prior reports with a label "legacy" next to them for you to continue to access.

Site Configuration, which contains Placements, Layouts, and Conditional Placements.

Audience, which contains Segment Library, Segment Export, and User Profile.

Admin, which contains various administration functions based on your user permissions for your site.
Lastly, under all of the other menu items, you will find our Feedback, Training, and Support.
The home page offers several different reports, dependent on which Algonomy products your site uses. Each of the reports use a currency filter in the right column that defaults to the default currency for the site. In addition, you can set the defaults individually for each report with the configuration option in the upper right corner of the report. Currently, these reports are:
Top 10 Categories, Products, Brands
The Top 10 Categories, Products, Brands on the home page shows the top 10 Categories, Brands or Products for the last 7 or 30 days, based on either Clicks, Clickthrough Rate, Attributable Sales, or Sales. If you click on the View Merchandising Report link, you will open a new window to the full Merchandising Report.

Sales Metrics
The Sales Metrics graph on the home page provides a number of sales metrics for the last 7, 30, 90 days or Year to Date. To see all metrics, click the check box beside Select All. Otherwise, click the metrics you would like to see. Since the graph is showing one y-axis, choose metrics that are easy to compare.

Page Type Performance
The Page Type Performance chart on the home page showcases your site's performance for the last 7, 30 or 90 days or Year to Date for metrics that include Attributable Sales, Click-Through Rate, Clicks on Recs, Items from Recs, Orders from Recs and Page Views. To select all page types, click the checkbox next to Select All. Otherwise, click the box beside the specific pages you wish to view.

Search Performance
The Search Performance report compares Queries, Add to cart, and Findability metrics in a daily report. You can adjust the date range for longer periods where the default is the last 7 days,

Top Search Terms
The Top Search Terms is showing the top queries by number of queries, Clicks, Findabaility, and Conversion rate. The period is set to the last 7 days but you can adjust the start and end date for longer or shorter periods.

Top Products Purchased in the Last 60 Minutes
The last report gives you the Top Products Purchased in the Last 60 Minutes. There is a link to the real-time analytics report to look at additional metrics or periods, and to look at attributes of people that are viewing recs, clicking on recs or purchasing products, including the products that they are purchasing.

On the right column, there is a box where we identify the recent activity for the site by all users. You can see what others have been doing to help with collaboration, and you have a link to the activity log to look further back into the history of activity.
Also on the right column, there is a box where we show links to pages you have previously visited. You can easily click back to where you were, even if you had visited that page on another site.